The Finger Lakes region sits at a latitude where seasonal changes hit fast. A two-week window between budbreak and a late frost can define the whole vintage. That kind of compressed calendar is exactly where satellite imagery earns its keep — not as a gimmick, but as a tool that lets you see the entire farm at once, on your timeline, without walking every row.
This walkthrough uses the Cornell Lake Erie Research and Extension Laboratory (CLEREL) as our test vineyard. CLEREL runs some of the most rigorous viticultural research in the northeastern US, which makes it a good proving ground: the blocks are clearly delineated, the variety list is long, and there's enough historical data to put new observations in context.
By the end you'll know how to go from a blank map to a block-level NDVI reading in a single session.
What you're looking at
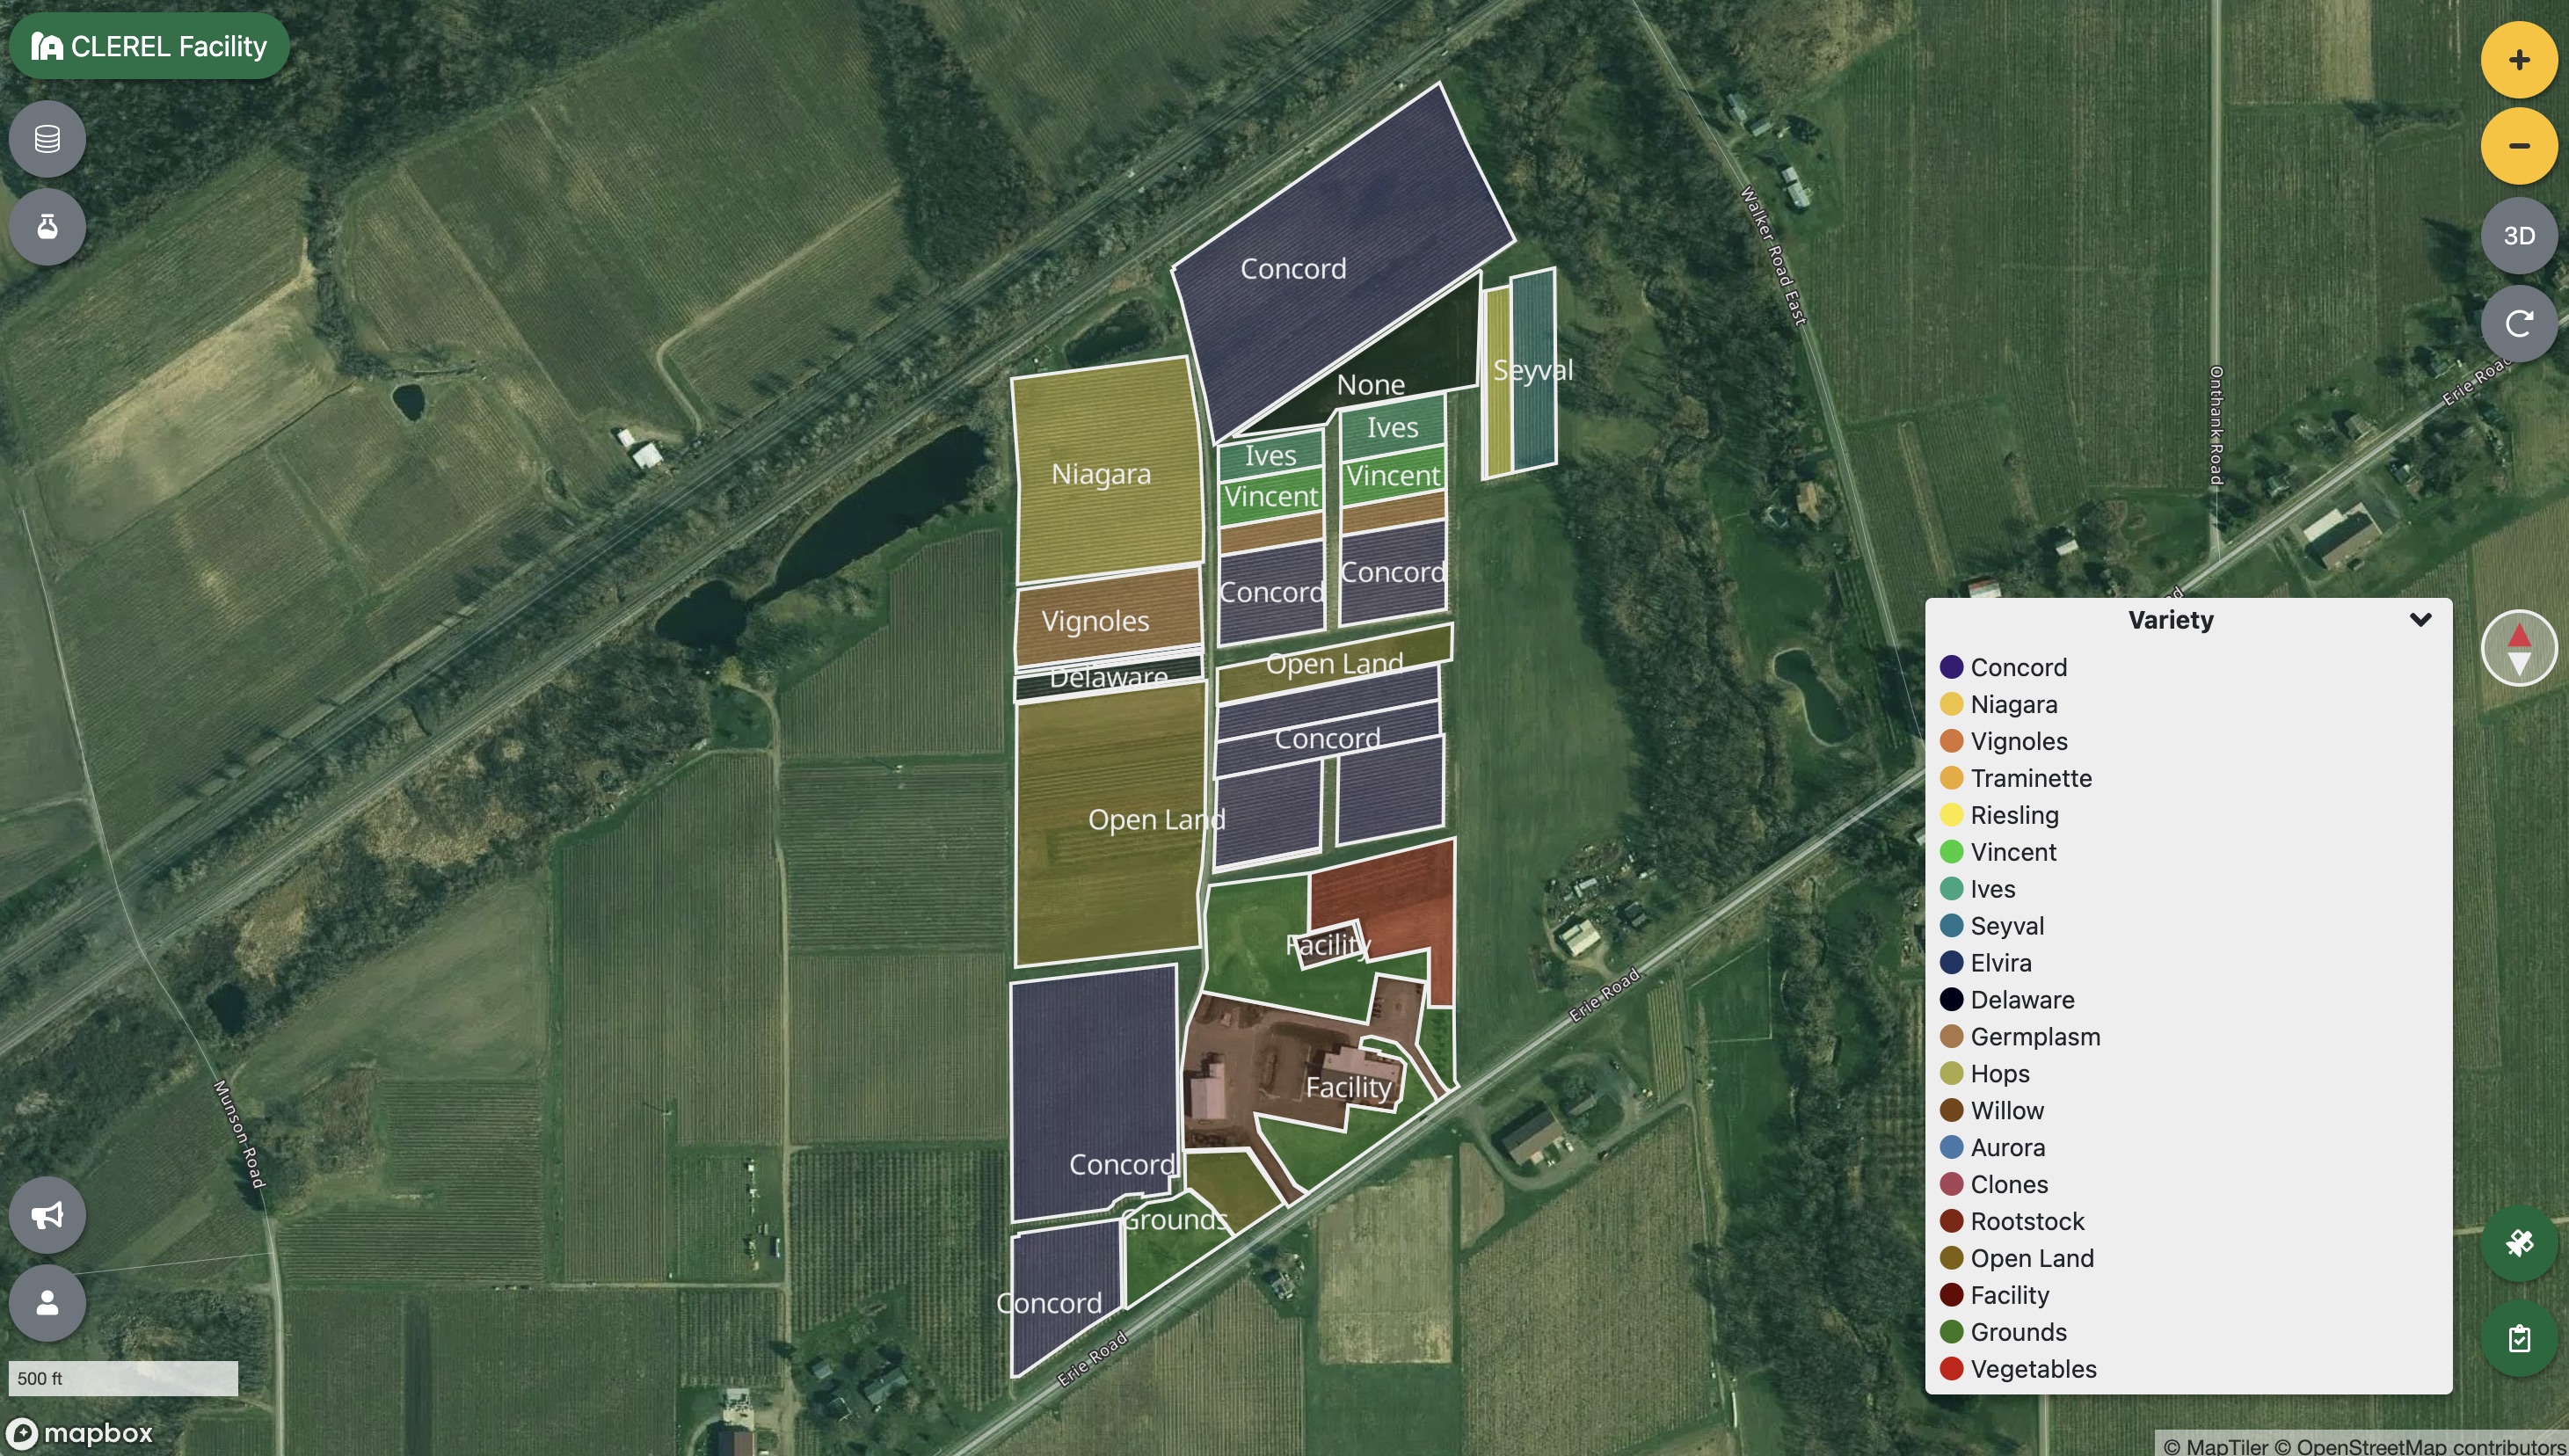
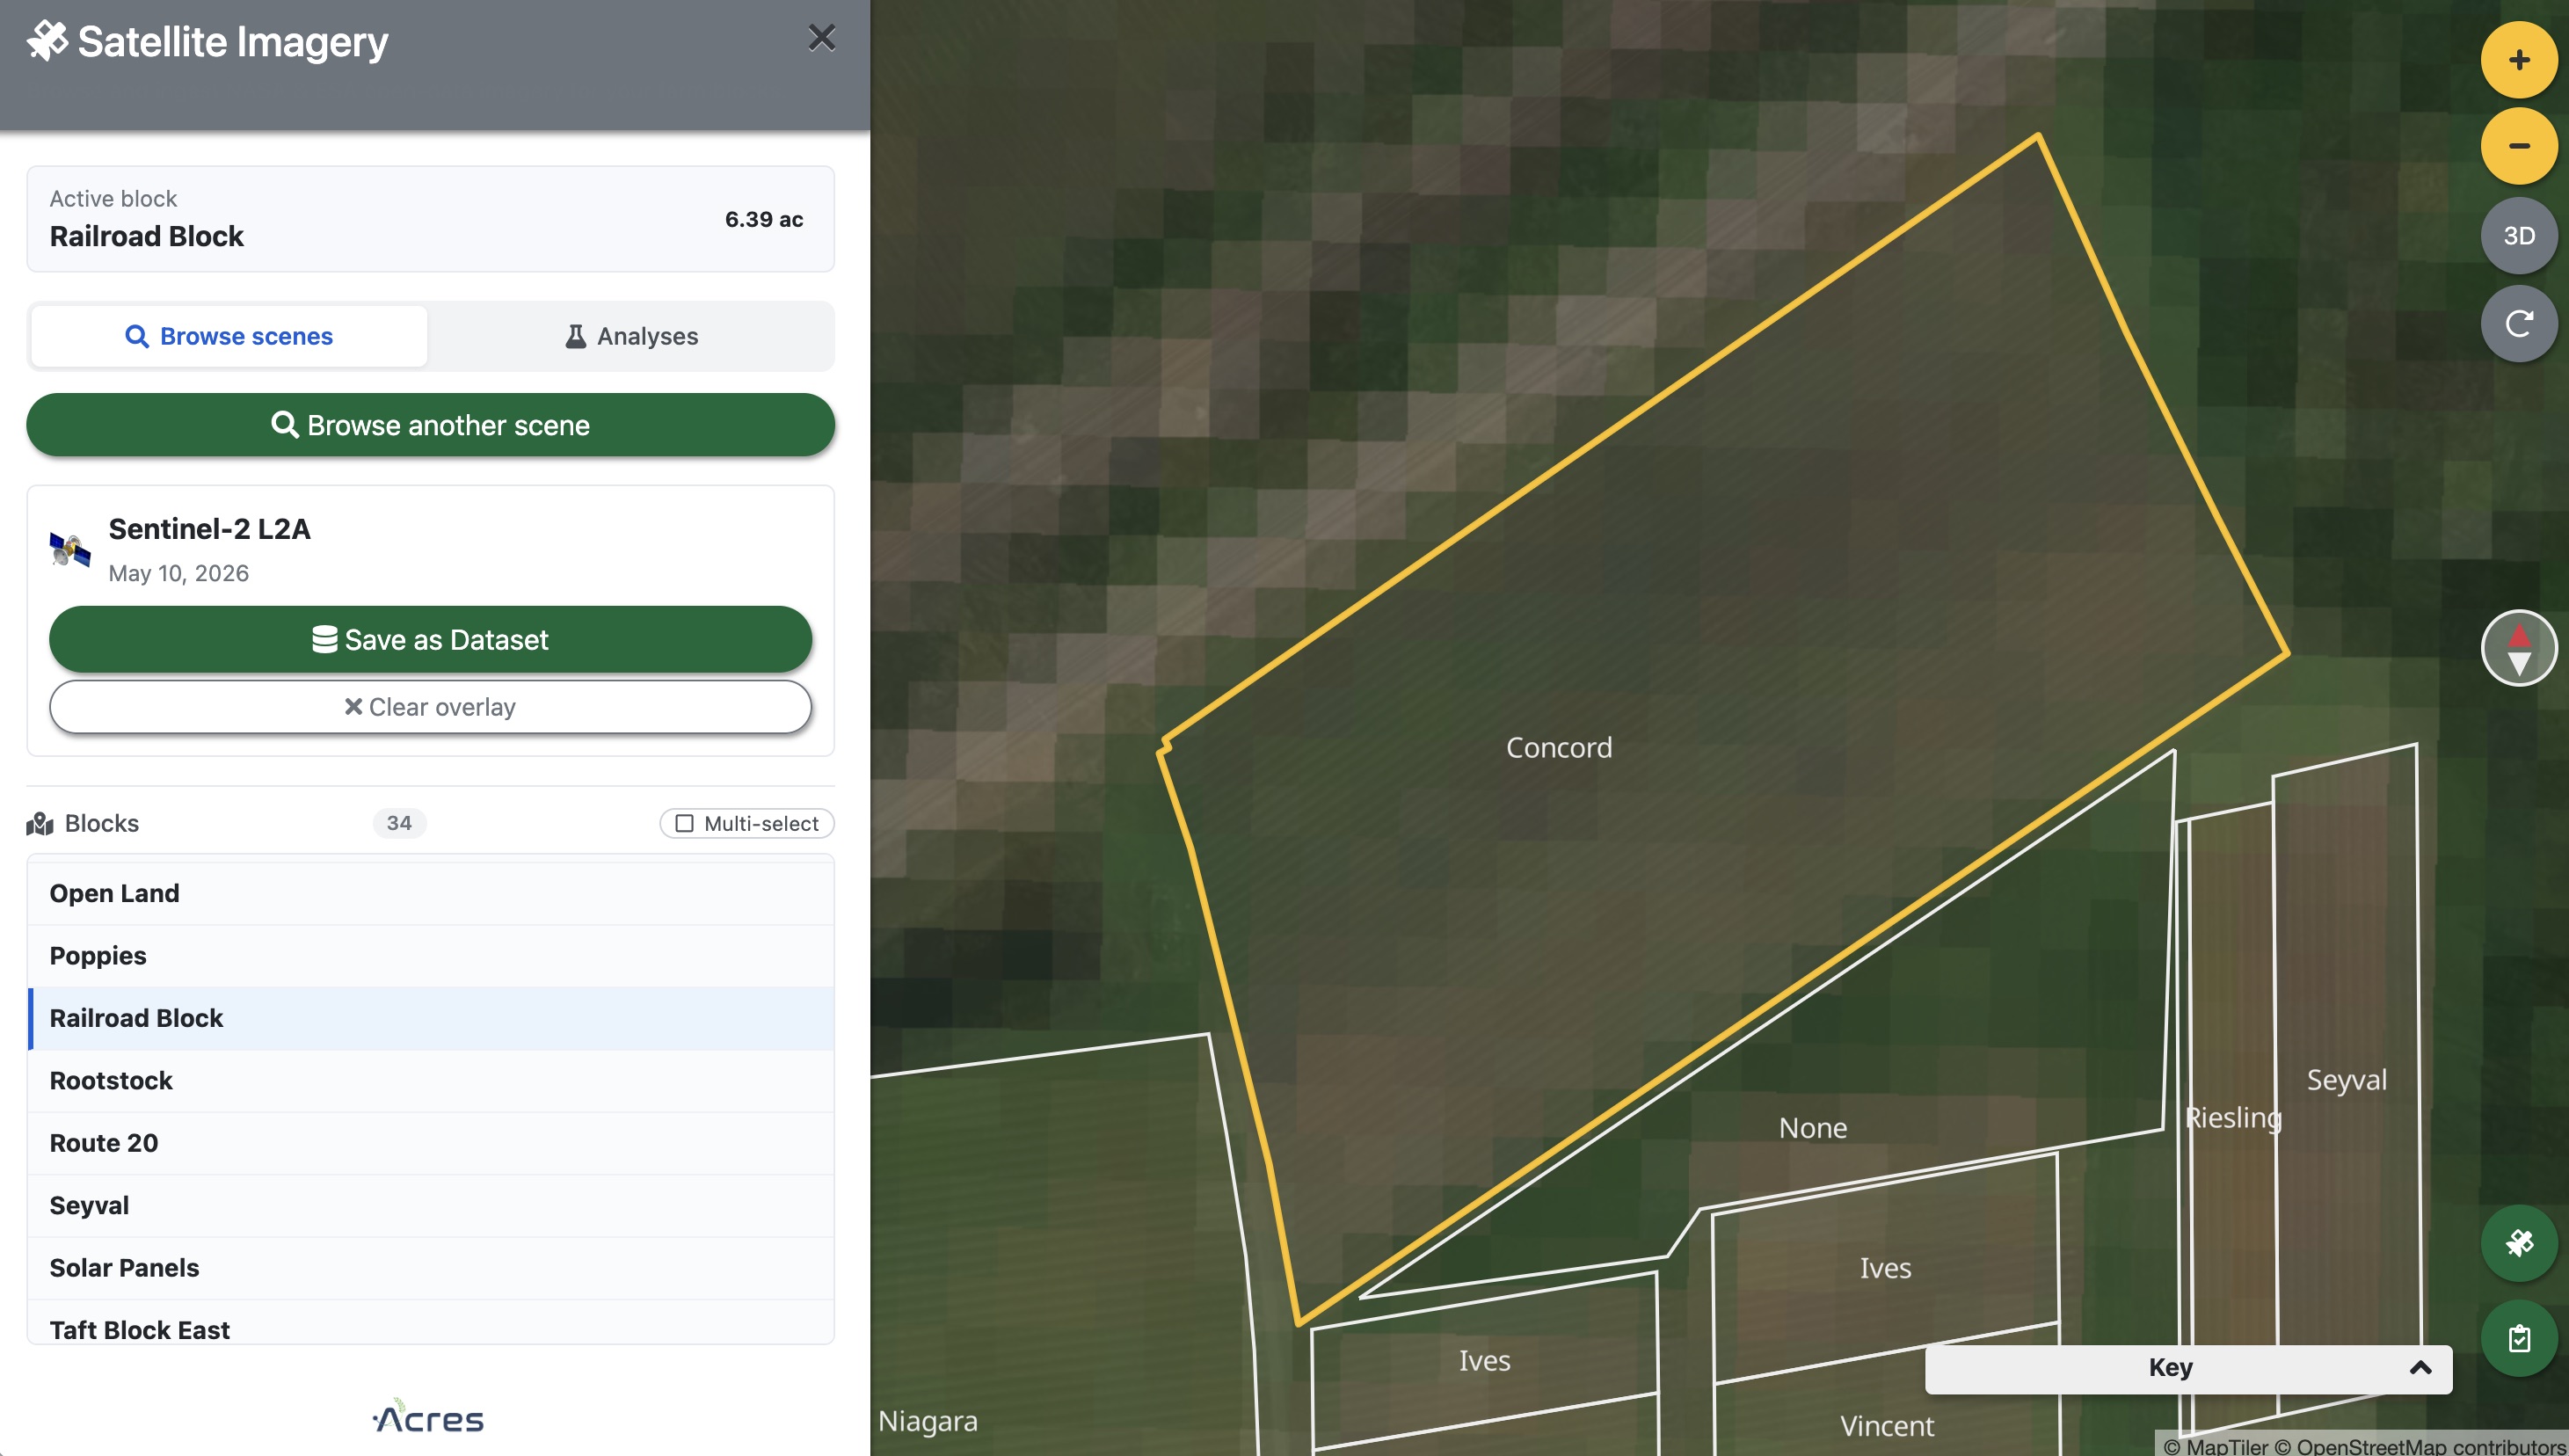
When you first open CLEREL in Every.Farm, the map shows every block color-coded by grape variety — Concord in deep purple, Niagara in gold, Vignoles in olive, and so on down the variety list. That's your baseline: who's planted where, how many acres, which rows face which direction.
Before you pull satellite data, spend thirty seconds orienting yourself. CLEREL's blocks run roughly north–south along Erie Road. The northern end is heavier on Concord; the southern cluster mixes research plots, open land, and the facility grounds itself. Knowing the layout means you'll be able to explain anomalies later — a low-NDVI patch that turns out to be a lane, not a struggling vine.
Step 1 — Pick a block and review its metadata
Click any block to open its detail panel. For this walkthrough we'll use the Railroad Block — 6.39 acres of Concord planted before 2008, with 9-foot row spacing and 8-foot vine spacing. The panel also shows year-by-year activity notes and historical tons-per-acre figures going back to 2021.
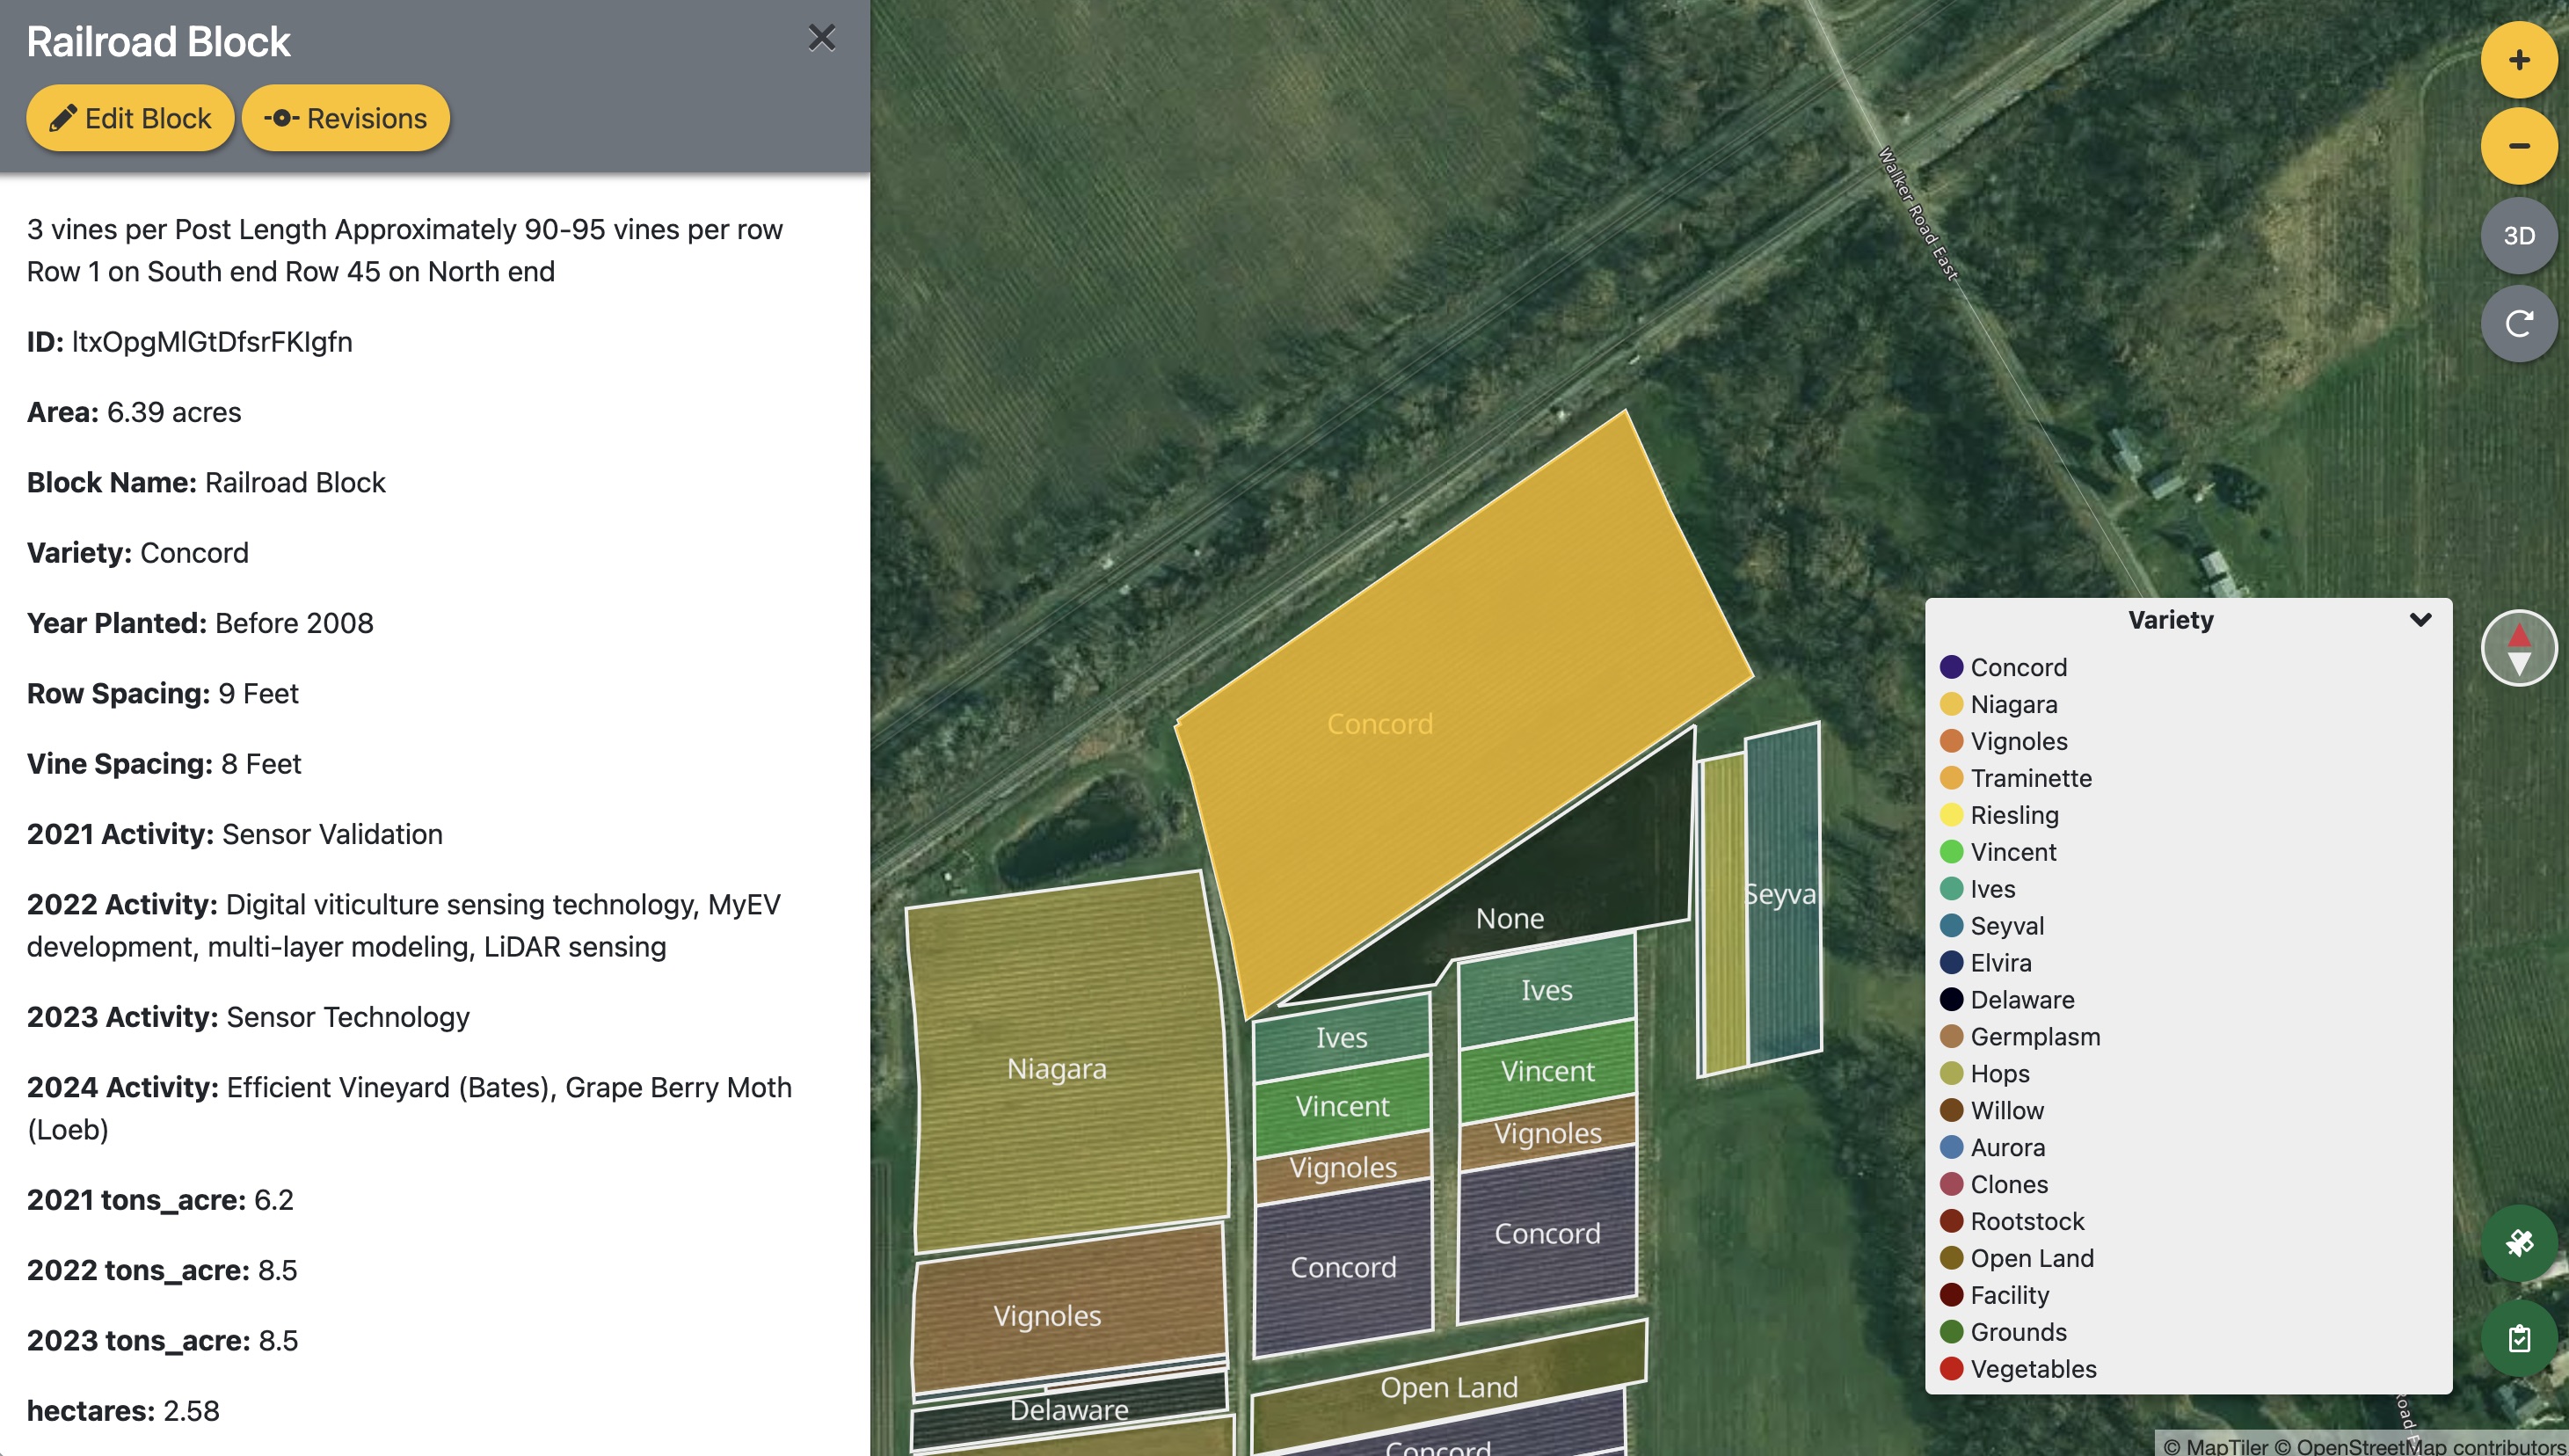
That yield history matters. A block averaging 8.5 tons/acre for three consecutive years gives you a baseline expectation. If the satellite shows something unusual in May, you're not guessing — you have something to compare against.
Step 2 — Open the Satellite Imagery plugin
Click the puzzle-piece icon in the bottom-right corner of the map to open the Satellite Imagery plugin. It attaches to whichever block is currently active, so Railroad Block will already be selected. You'll see two tabs — Browse scenes and Analyses — and a full block list below so you can switch blocks without closing the panel.
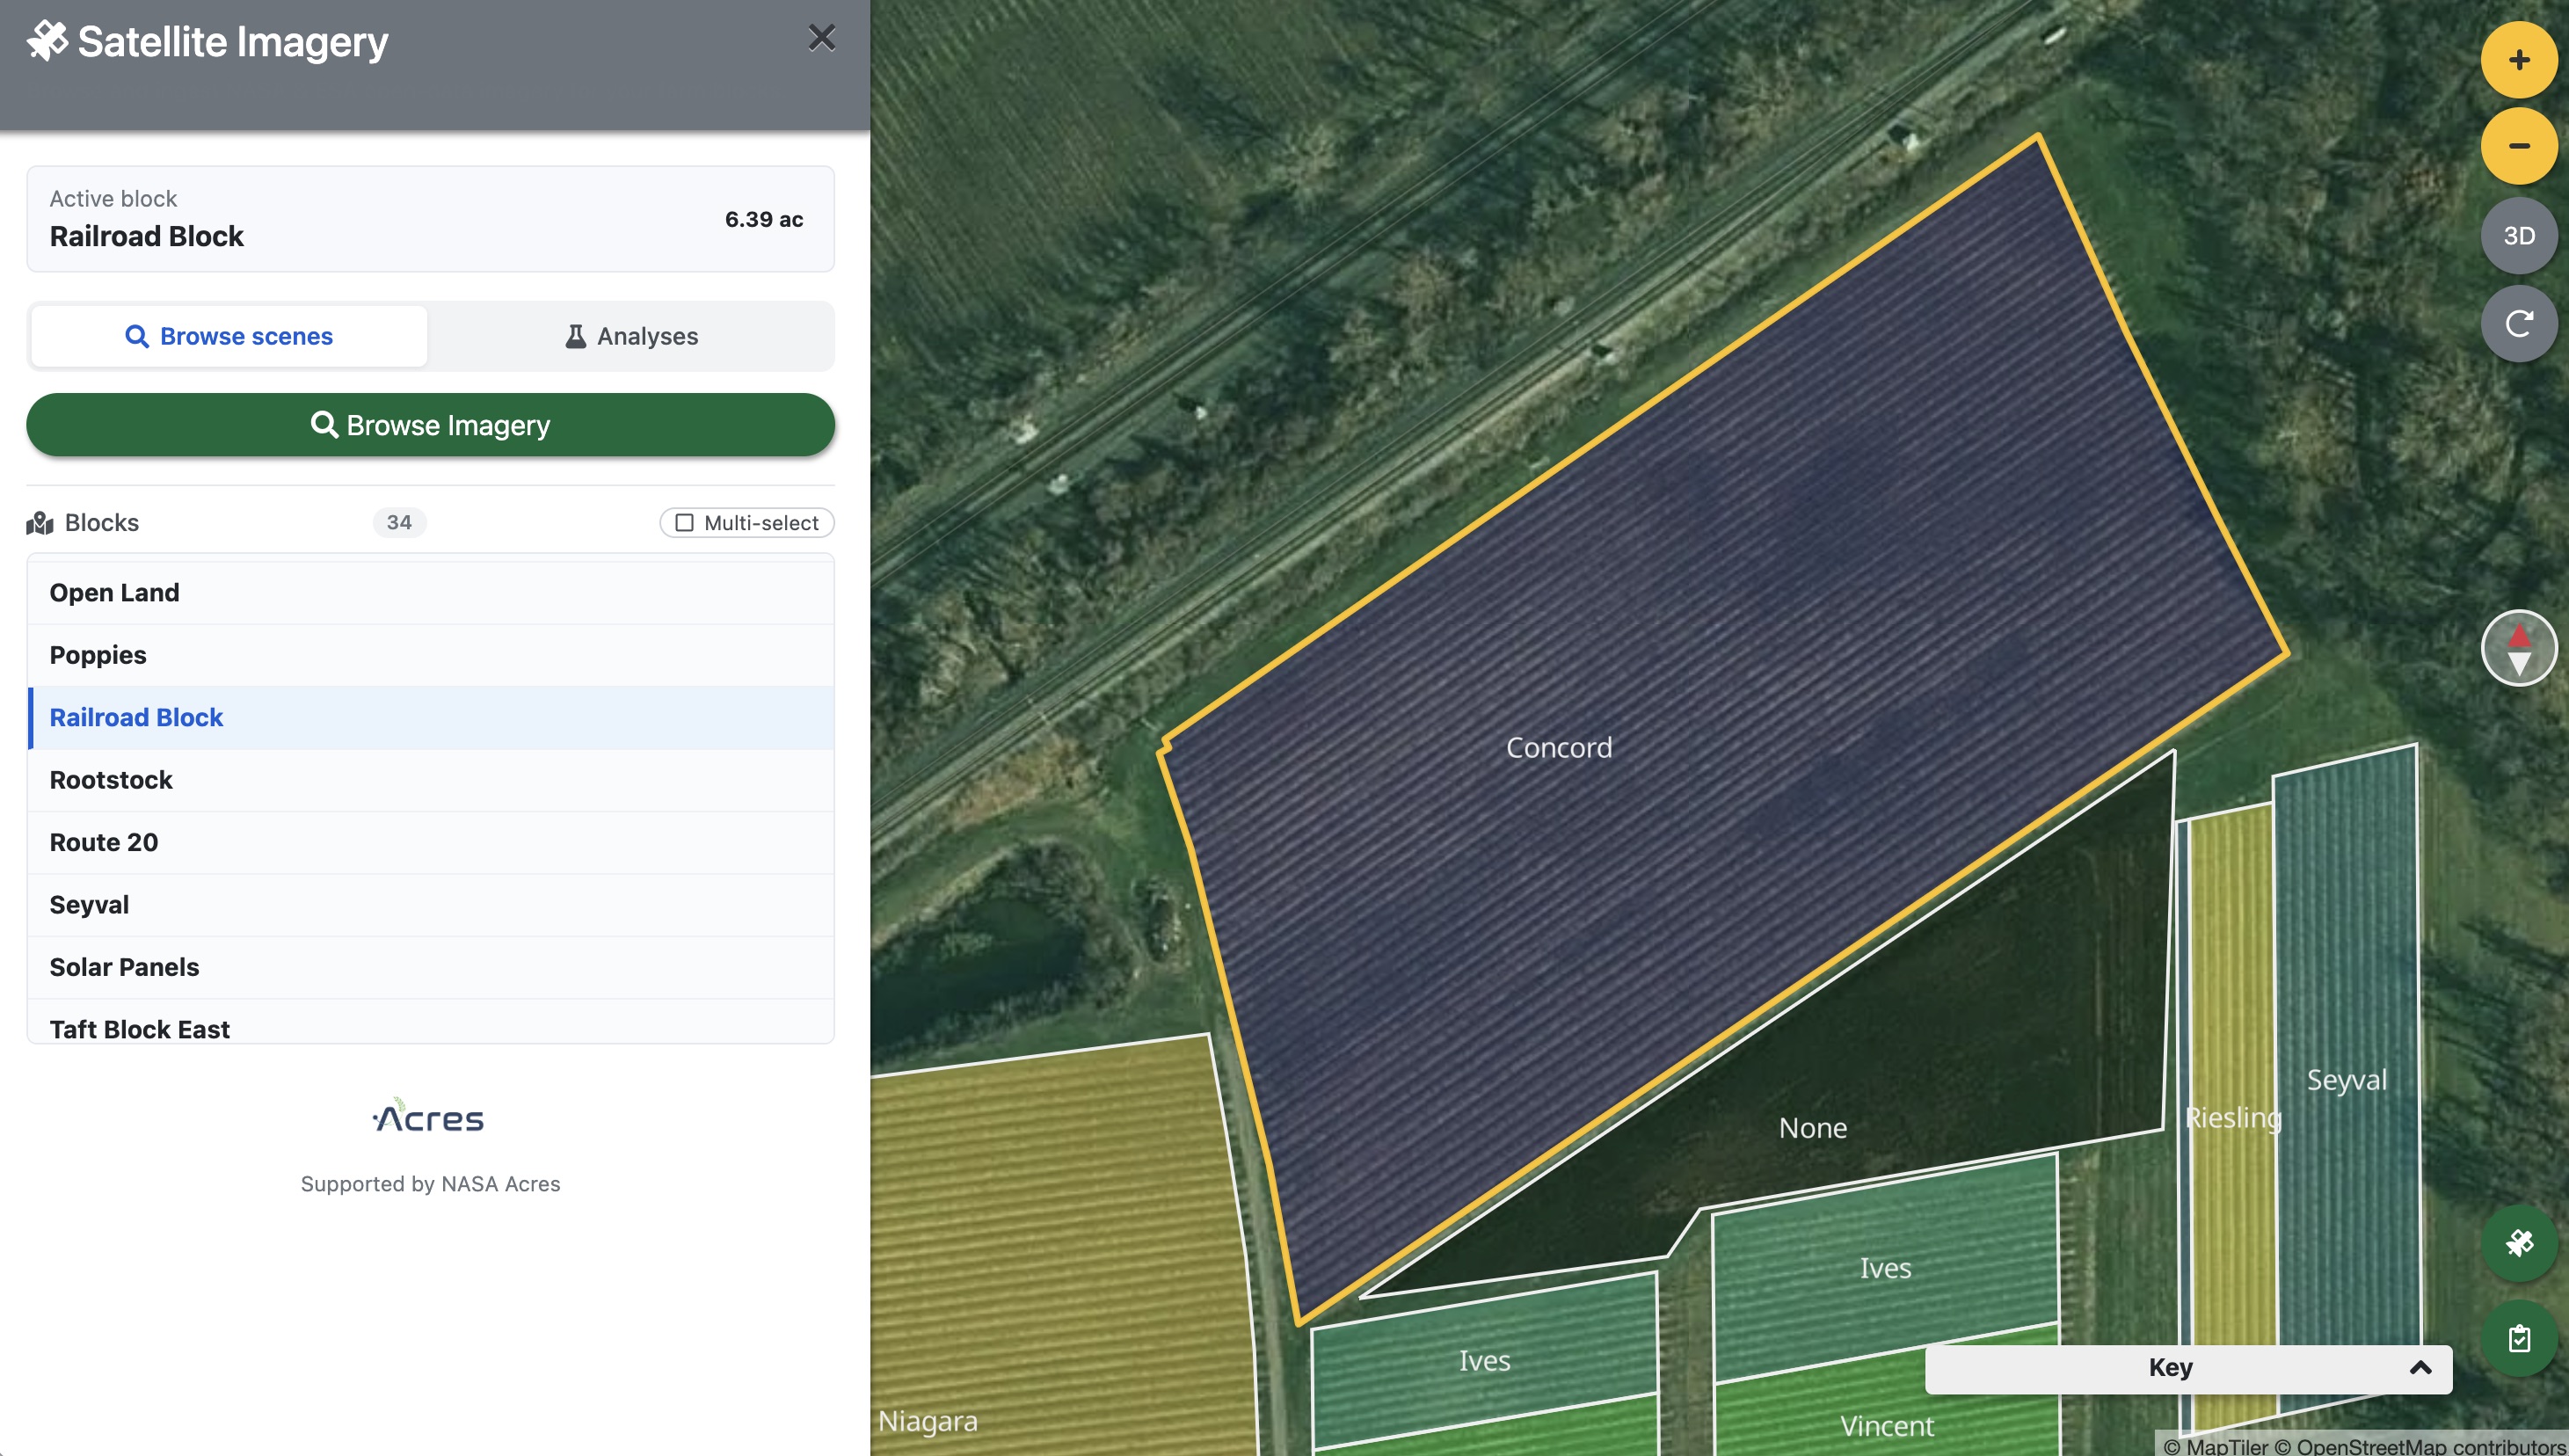
The plugin pulls from three sources by default: Landsat 8/9 C2 L2, Sentinel-1 RTC (radar), and Sentinel-2 L2A (optical). For early-season vine health work, Sentinel-2 is usually the right choice — 10-meter resolution, a revisit time of around five days, and the full optical band set needed for vegetation indices.
Step 3 — Browse and filter scenes
Click Browse Imagery and the scene selector opens. It defaults to showing the last 90 days, sorted newest first. You'll see each scene listed with its satellite, date, cloud cover percentage, resolution, and how many spectral assets are available.
Cloud cover is the key filter at this time of year. Anything above 20–25% over the Finger Lakes in May is likely to have patchy shadows across your blocks, which will corrupt NDVI readings without obviously looking wrong. Click the scene with the lowest cloud cover to select it.
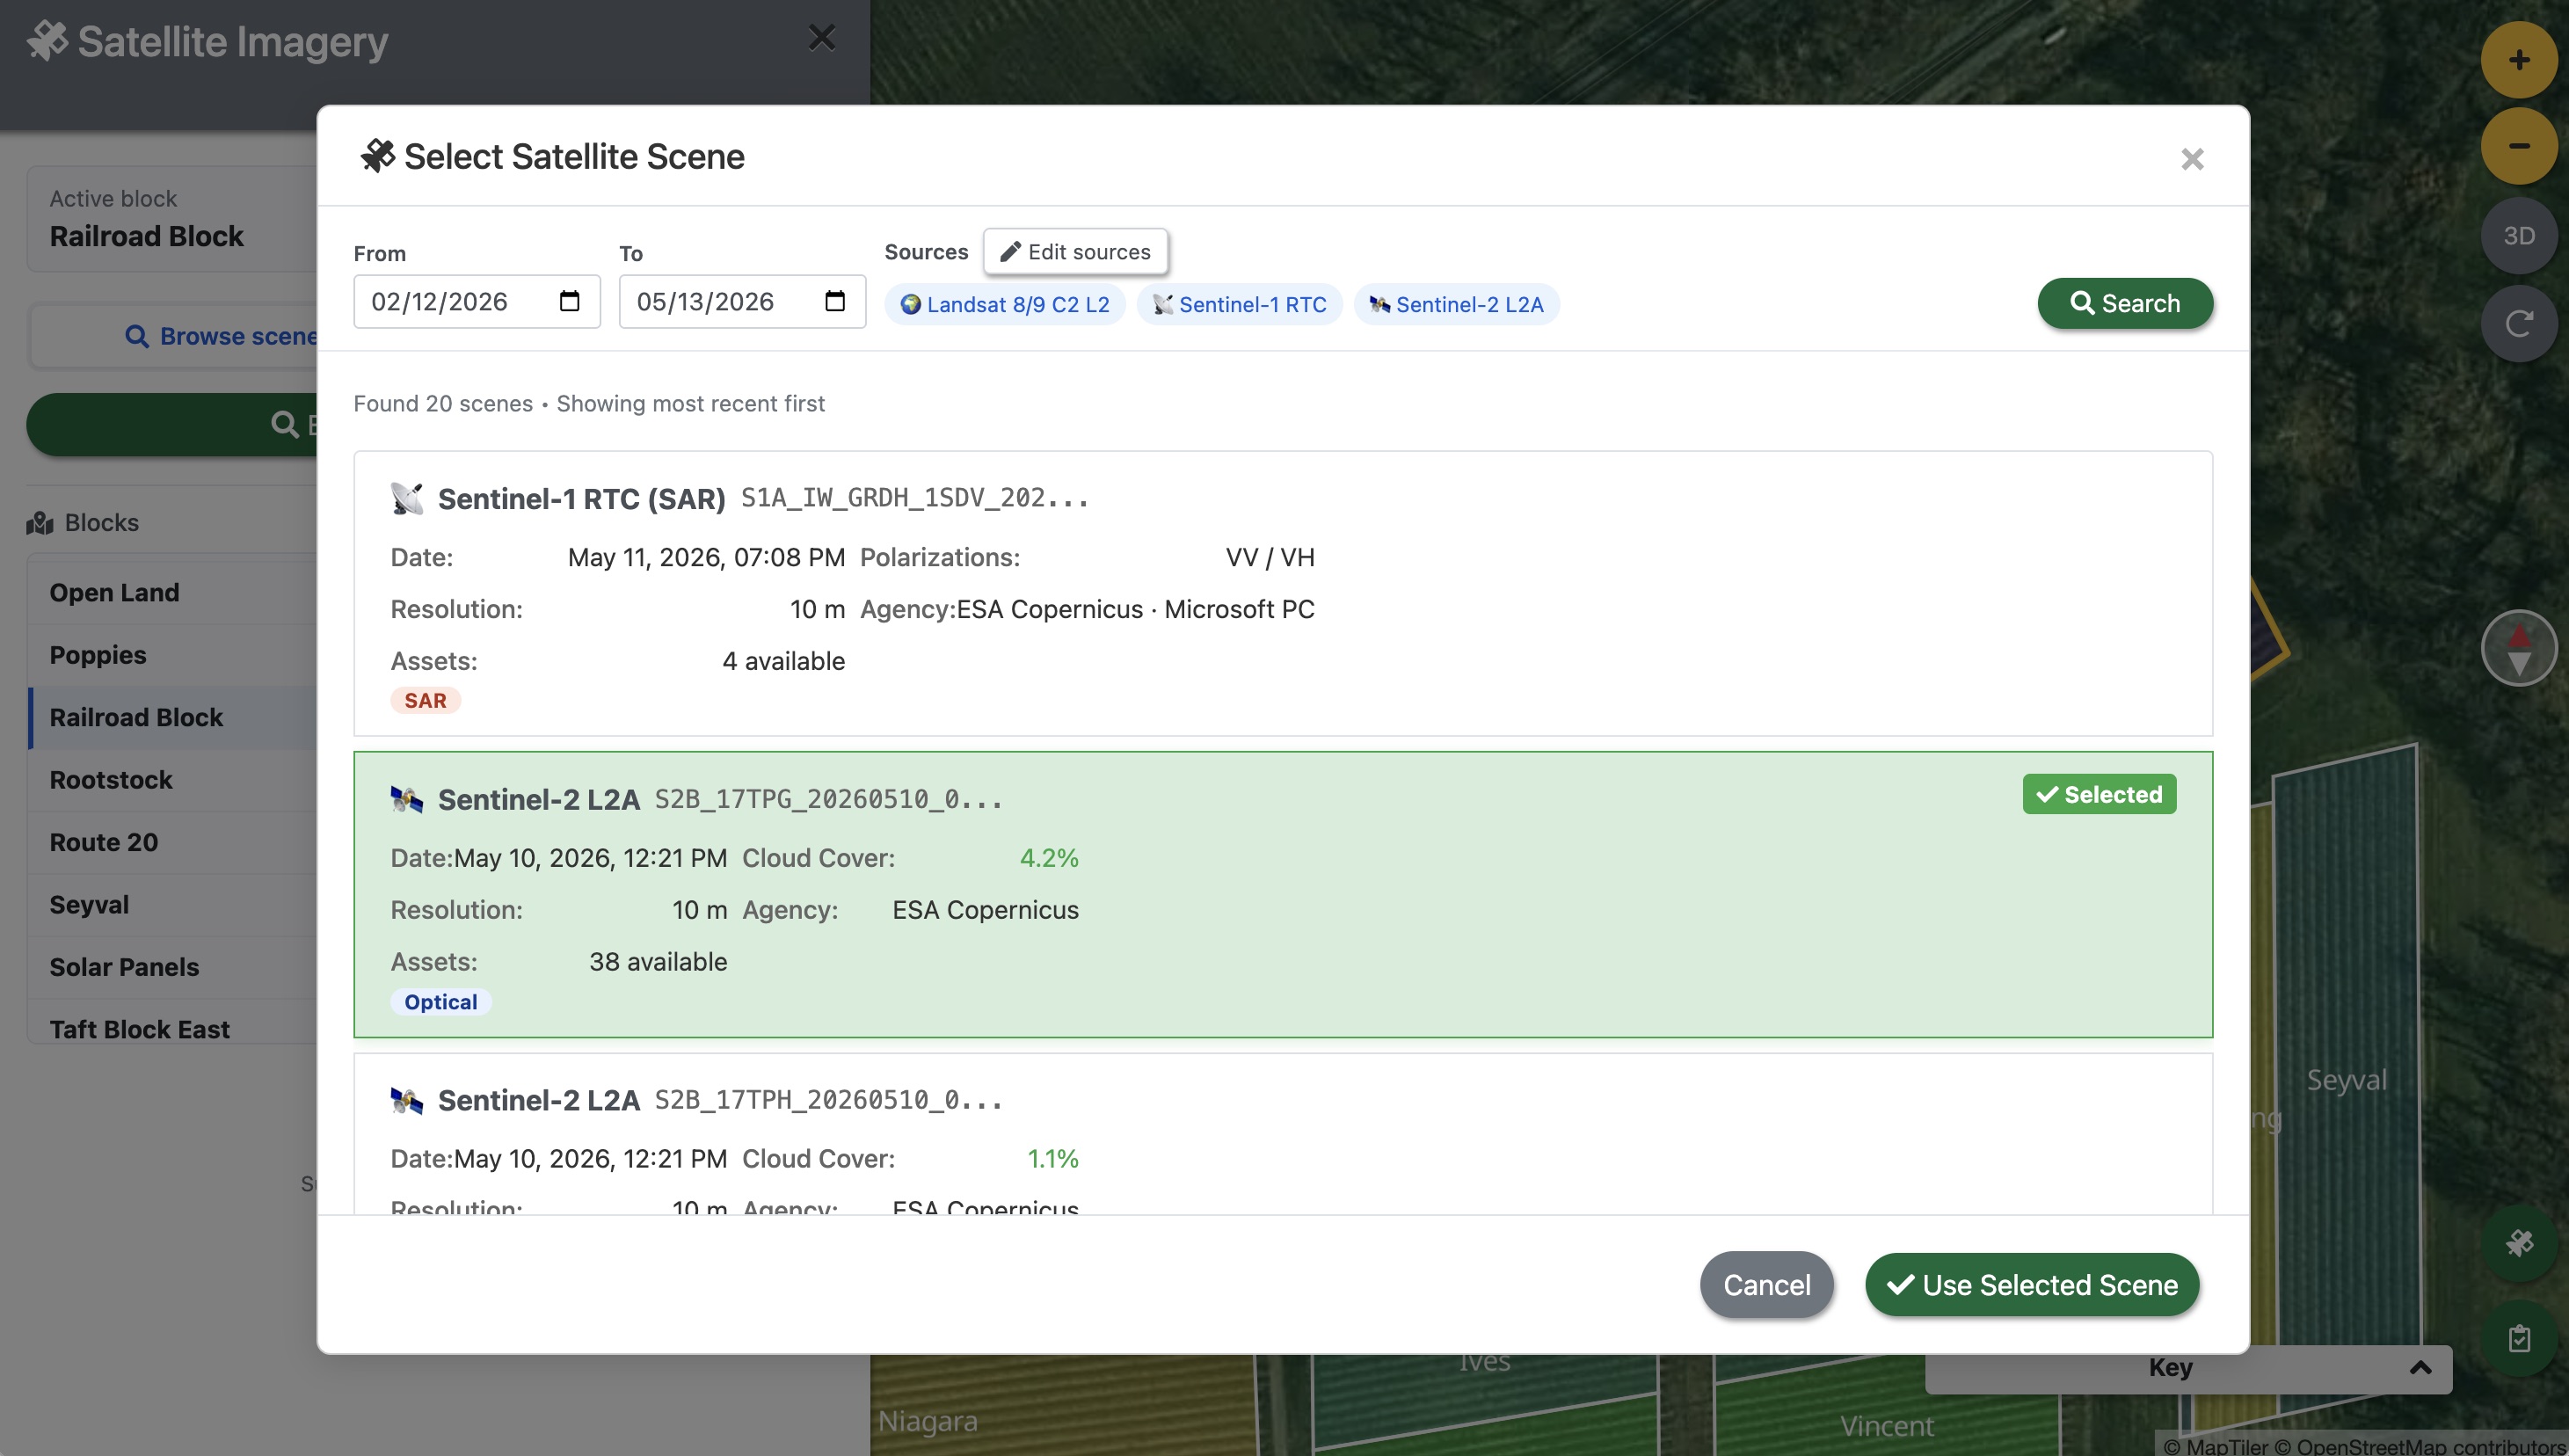
Click Use Selected Scene to load the imagery as a preview overlay on the map.
Step 4 — Preview the imagery
Once you confirm the scene, Every.Farm downloads and renders the raw Sentinel-2 bands directly on the map. You're now looking at actual satellite data from May 10 — not a basemap, not an illustration, but the reflectance values the satellite measured over these specific rows on that specific morning.
The preview uses the raw bands for display. To compute vegetation indices — NDVI and others — you need to save it as a processed dataset. Click Save as Dataset.
Step 5 — Choose your outputs
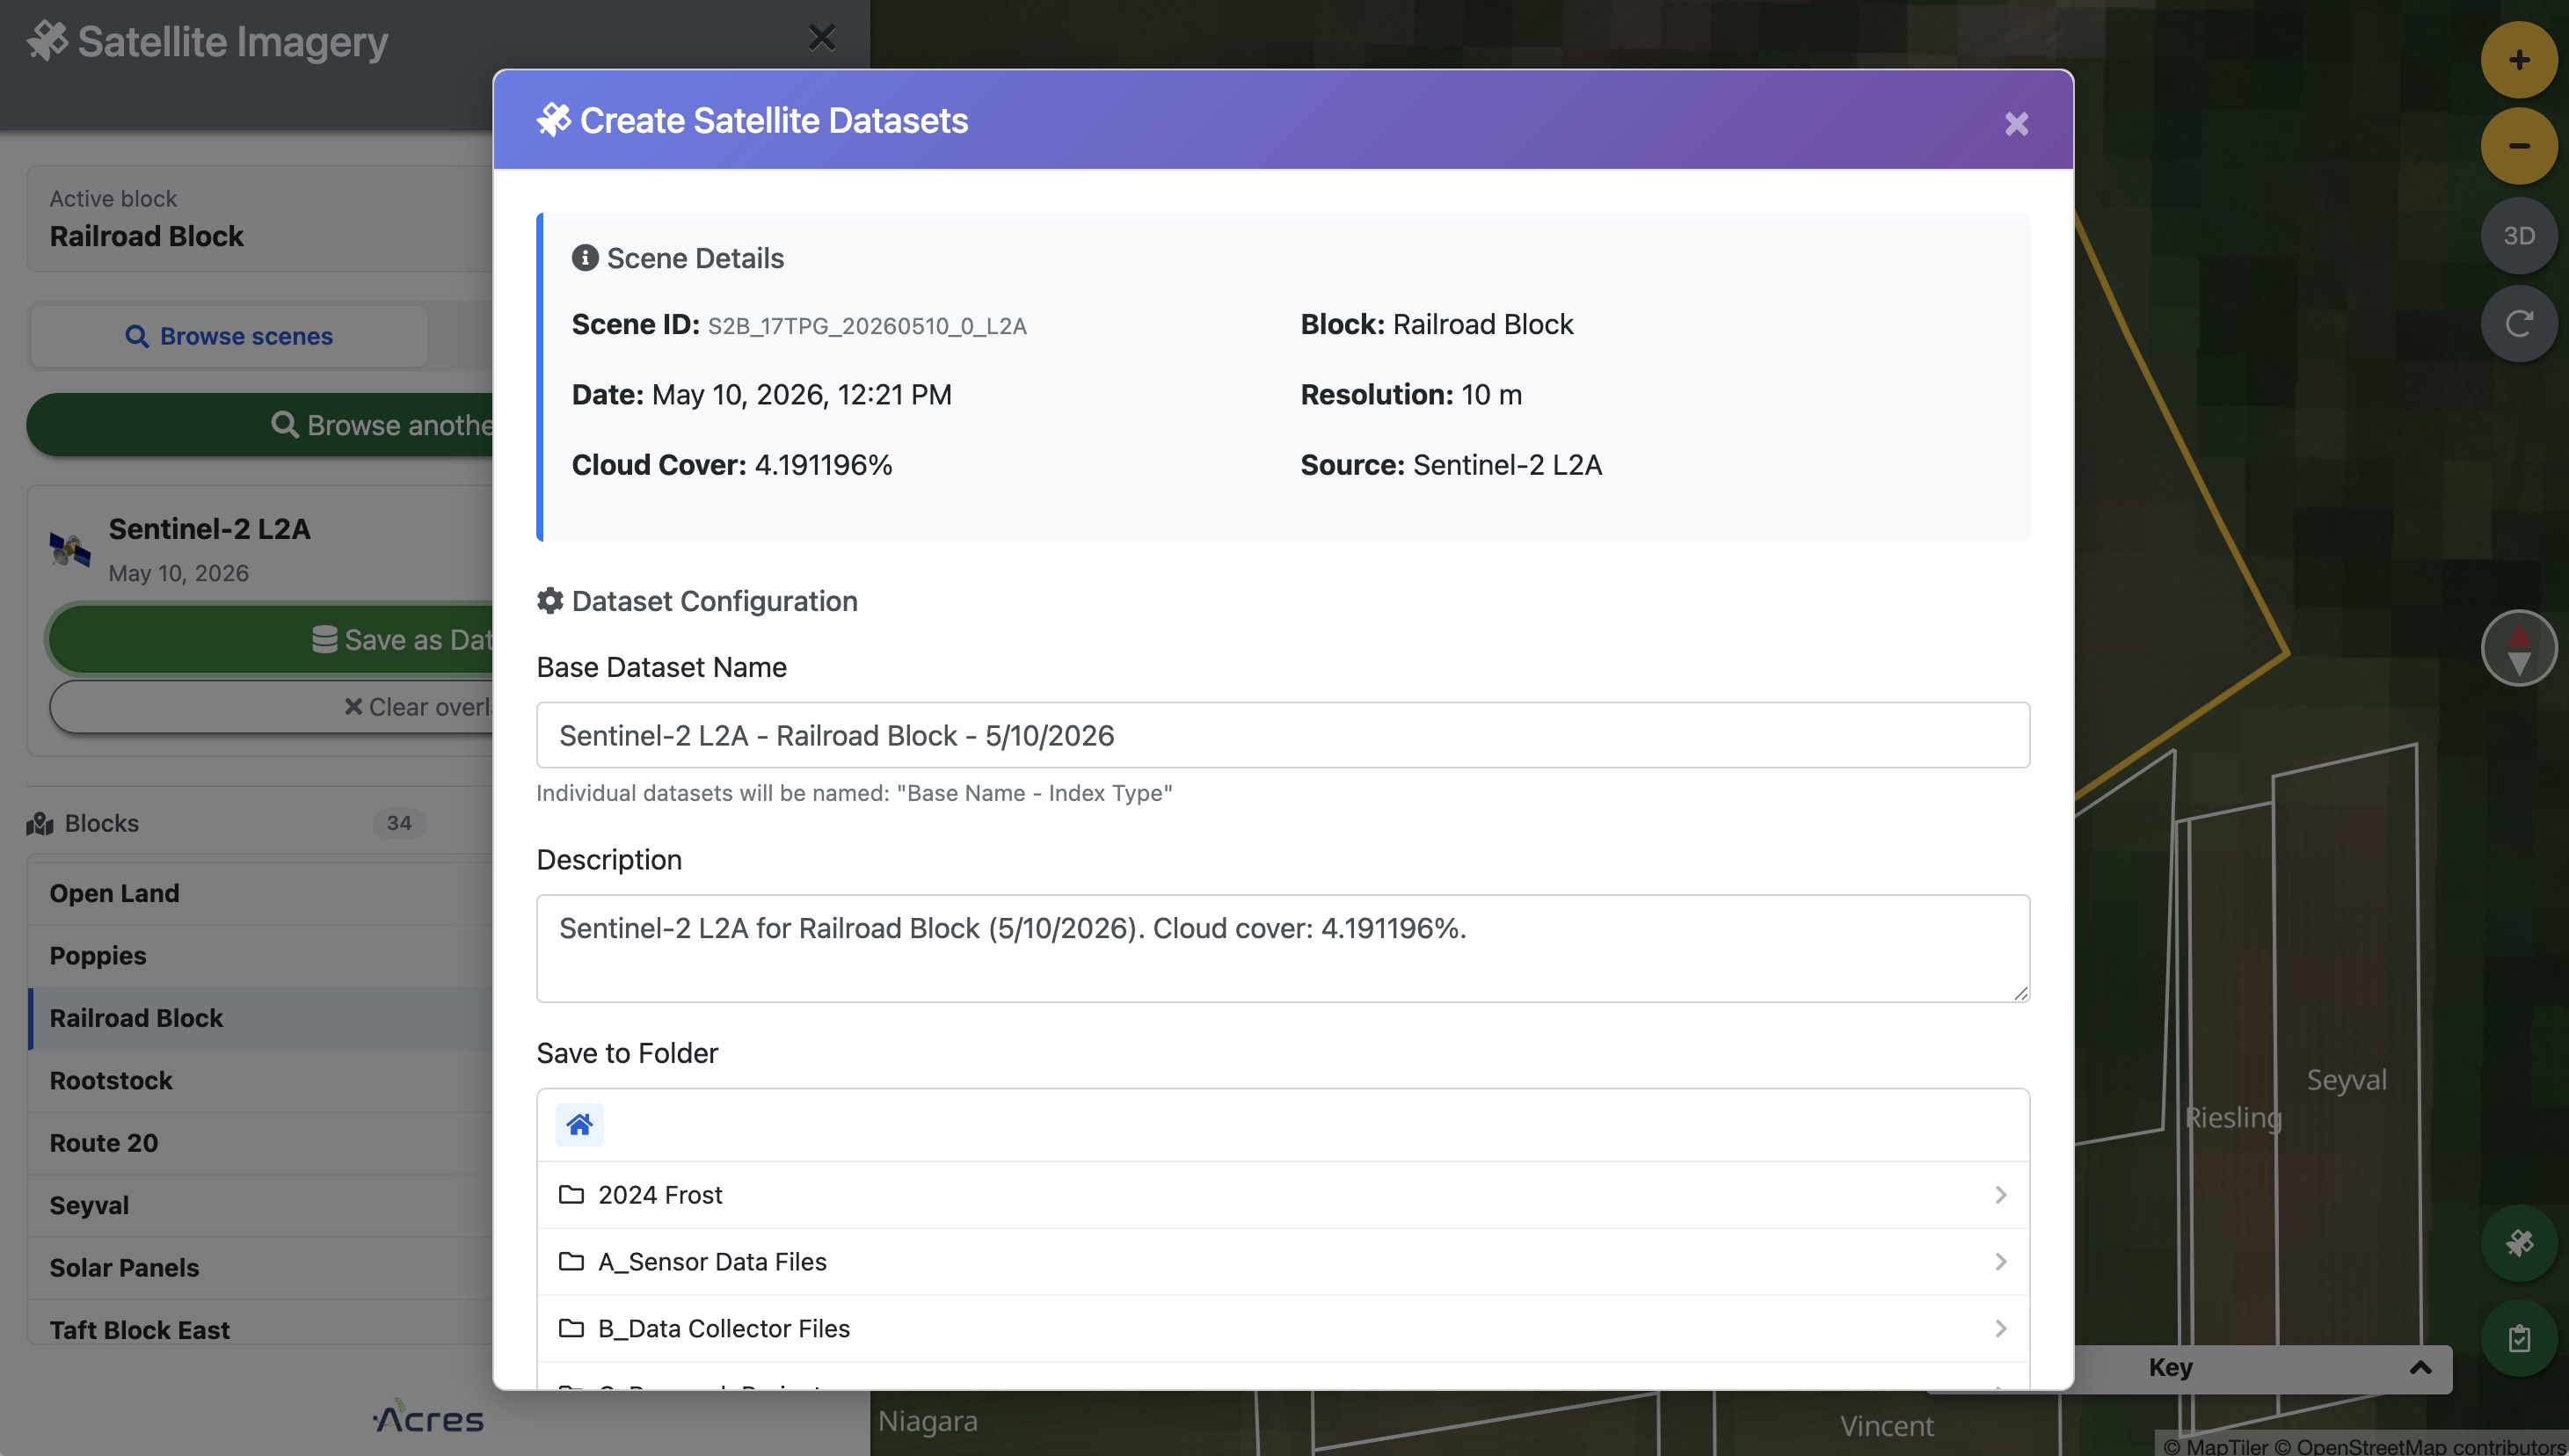
The Create Satellite Datasets modal has two sections worth understanding.
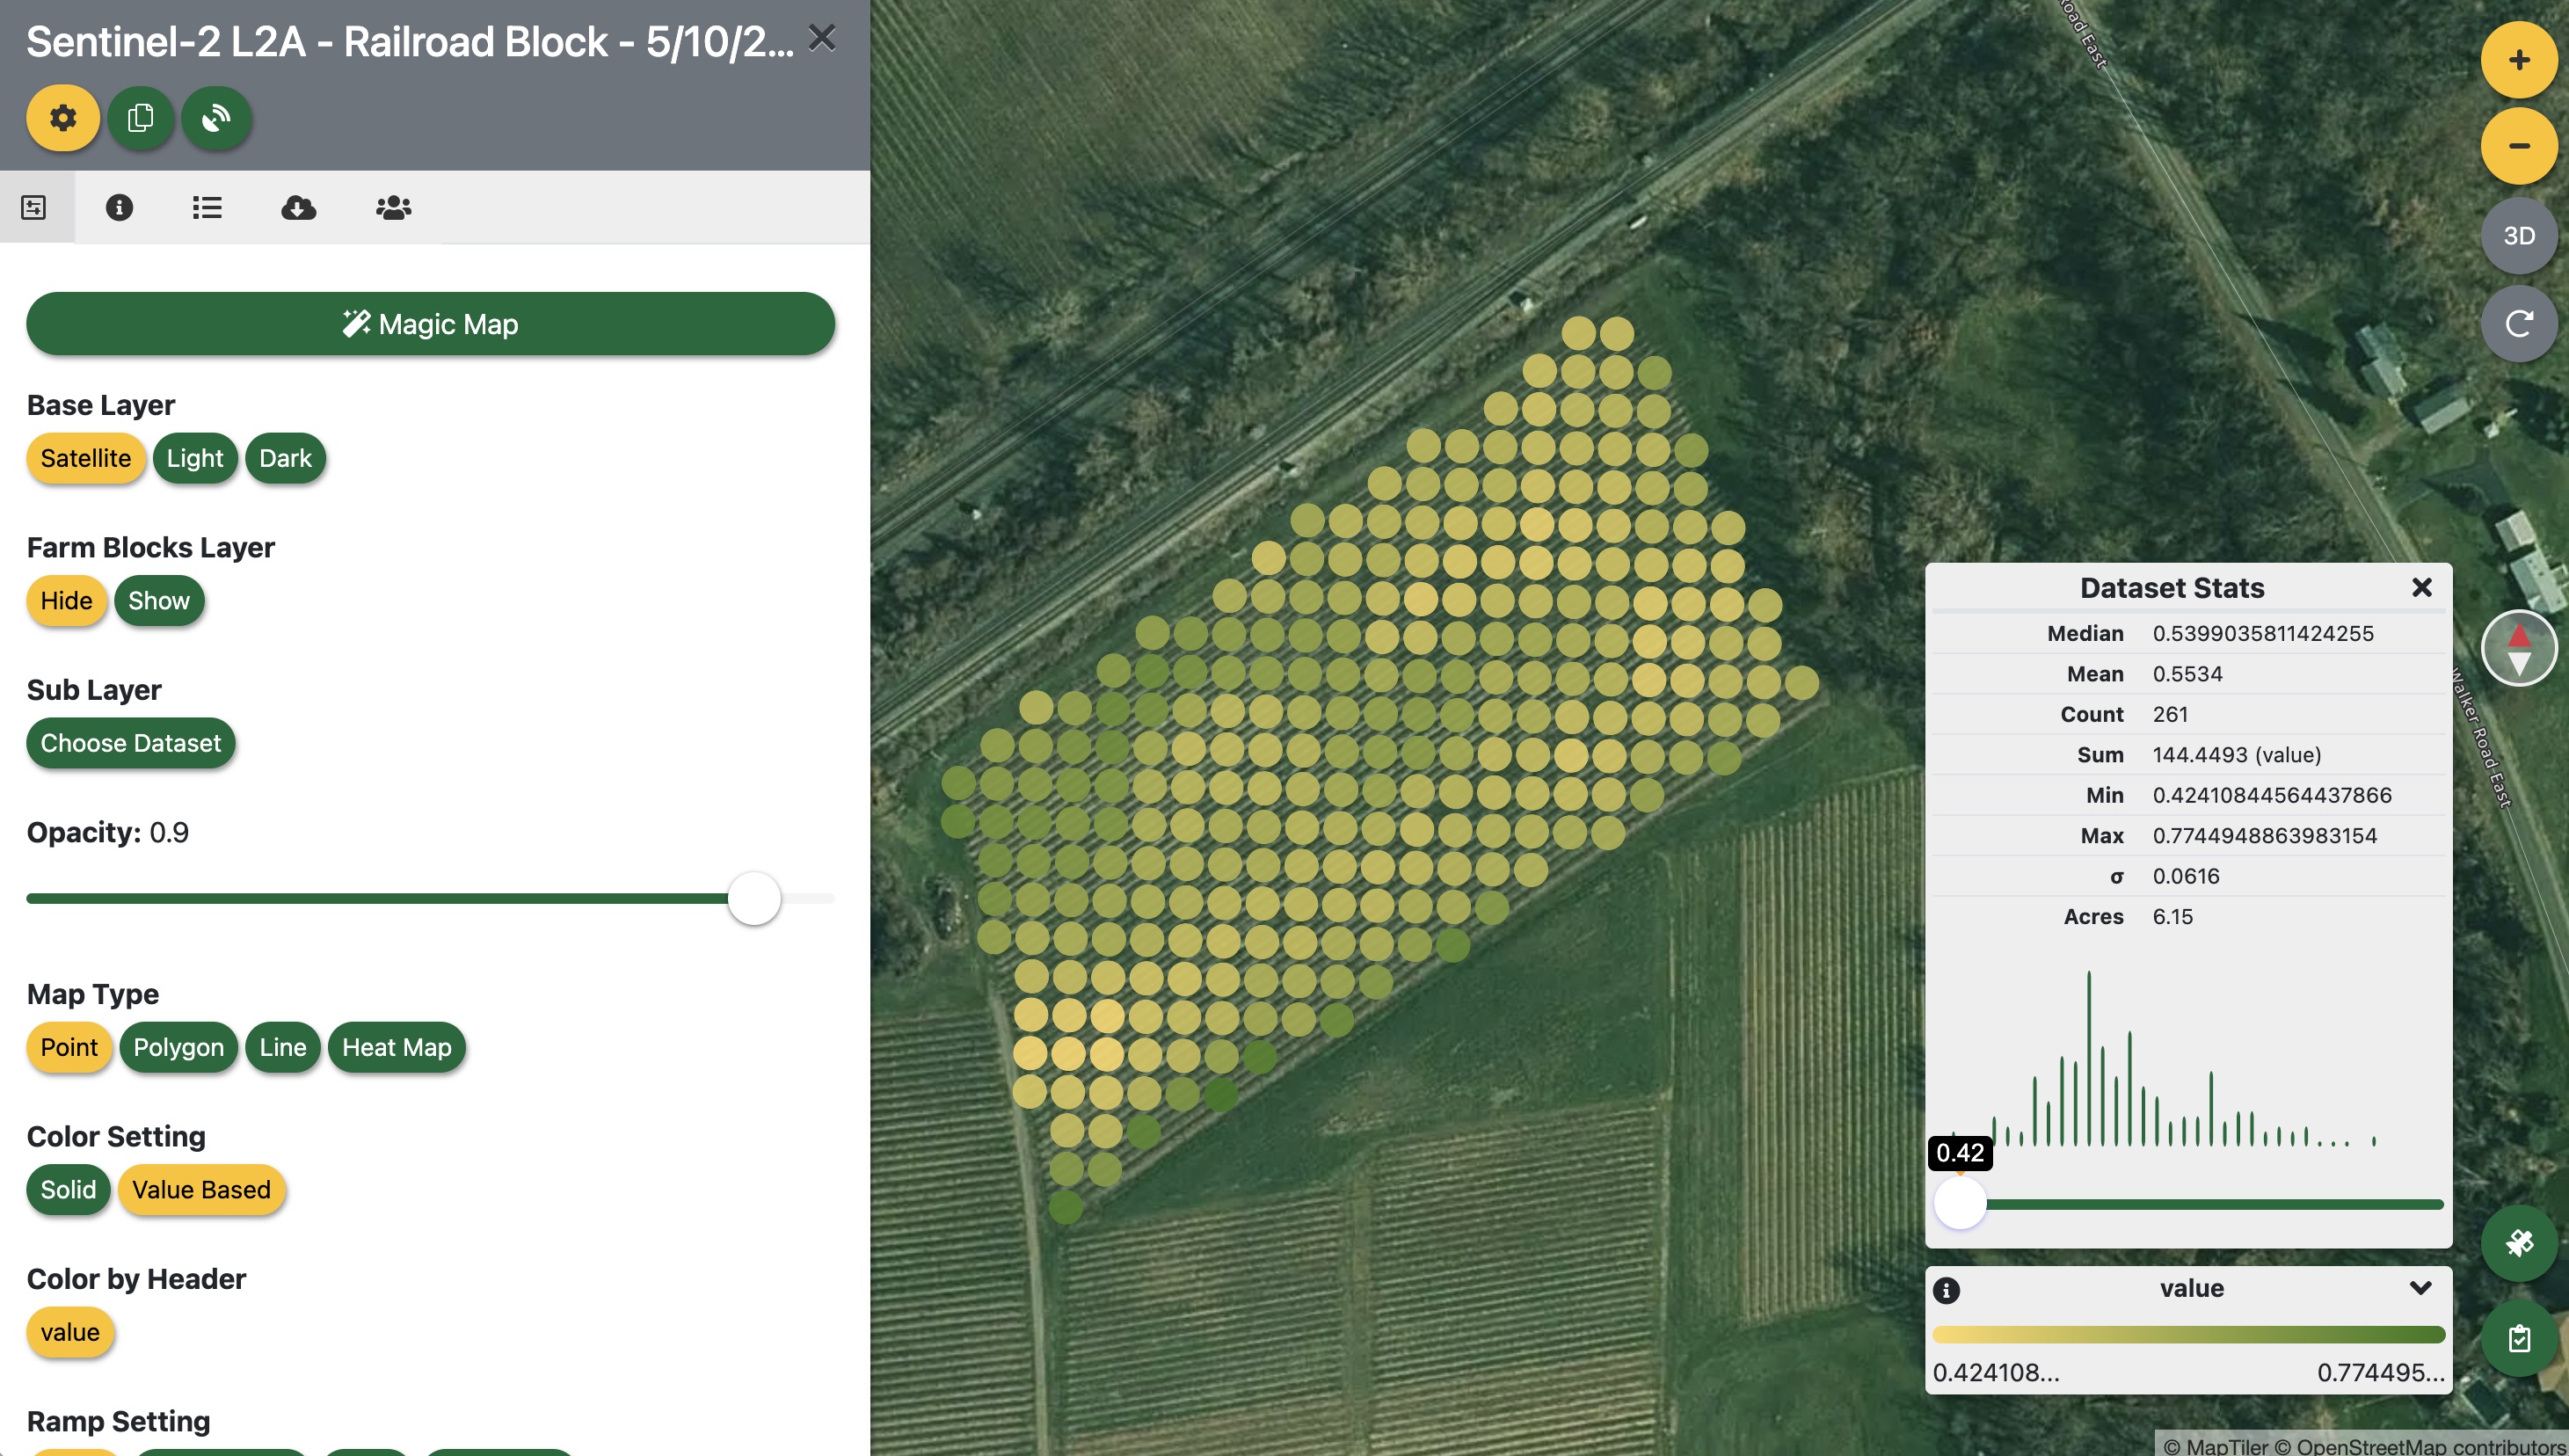
The top section confirms what you selected: Scene ID, date, cloud cover, resolution, source satellite, and which block it's anchored to. Give the dataset a name you'll recognize in six months — the auto-generated name ("Sentinel-2 L2A - Railroad Block - 5/10/2026") is usually fine to keep.
Scroll down to Select Outputs. Every.Farm pre-checks True Color Composite (RGB), which gives you a natural-color image useful for visual inspection and field comparison. For vine health analysis, also check NDVI.
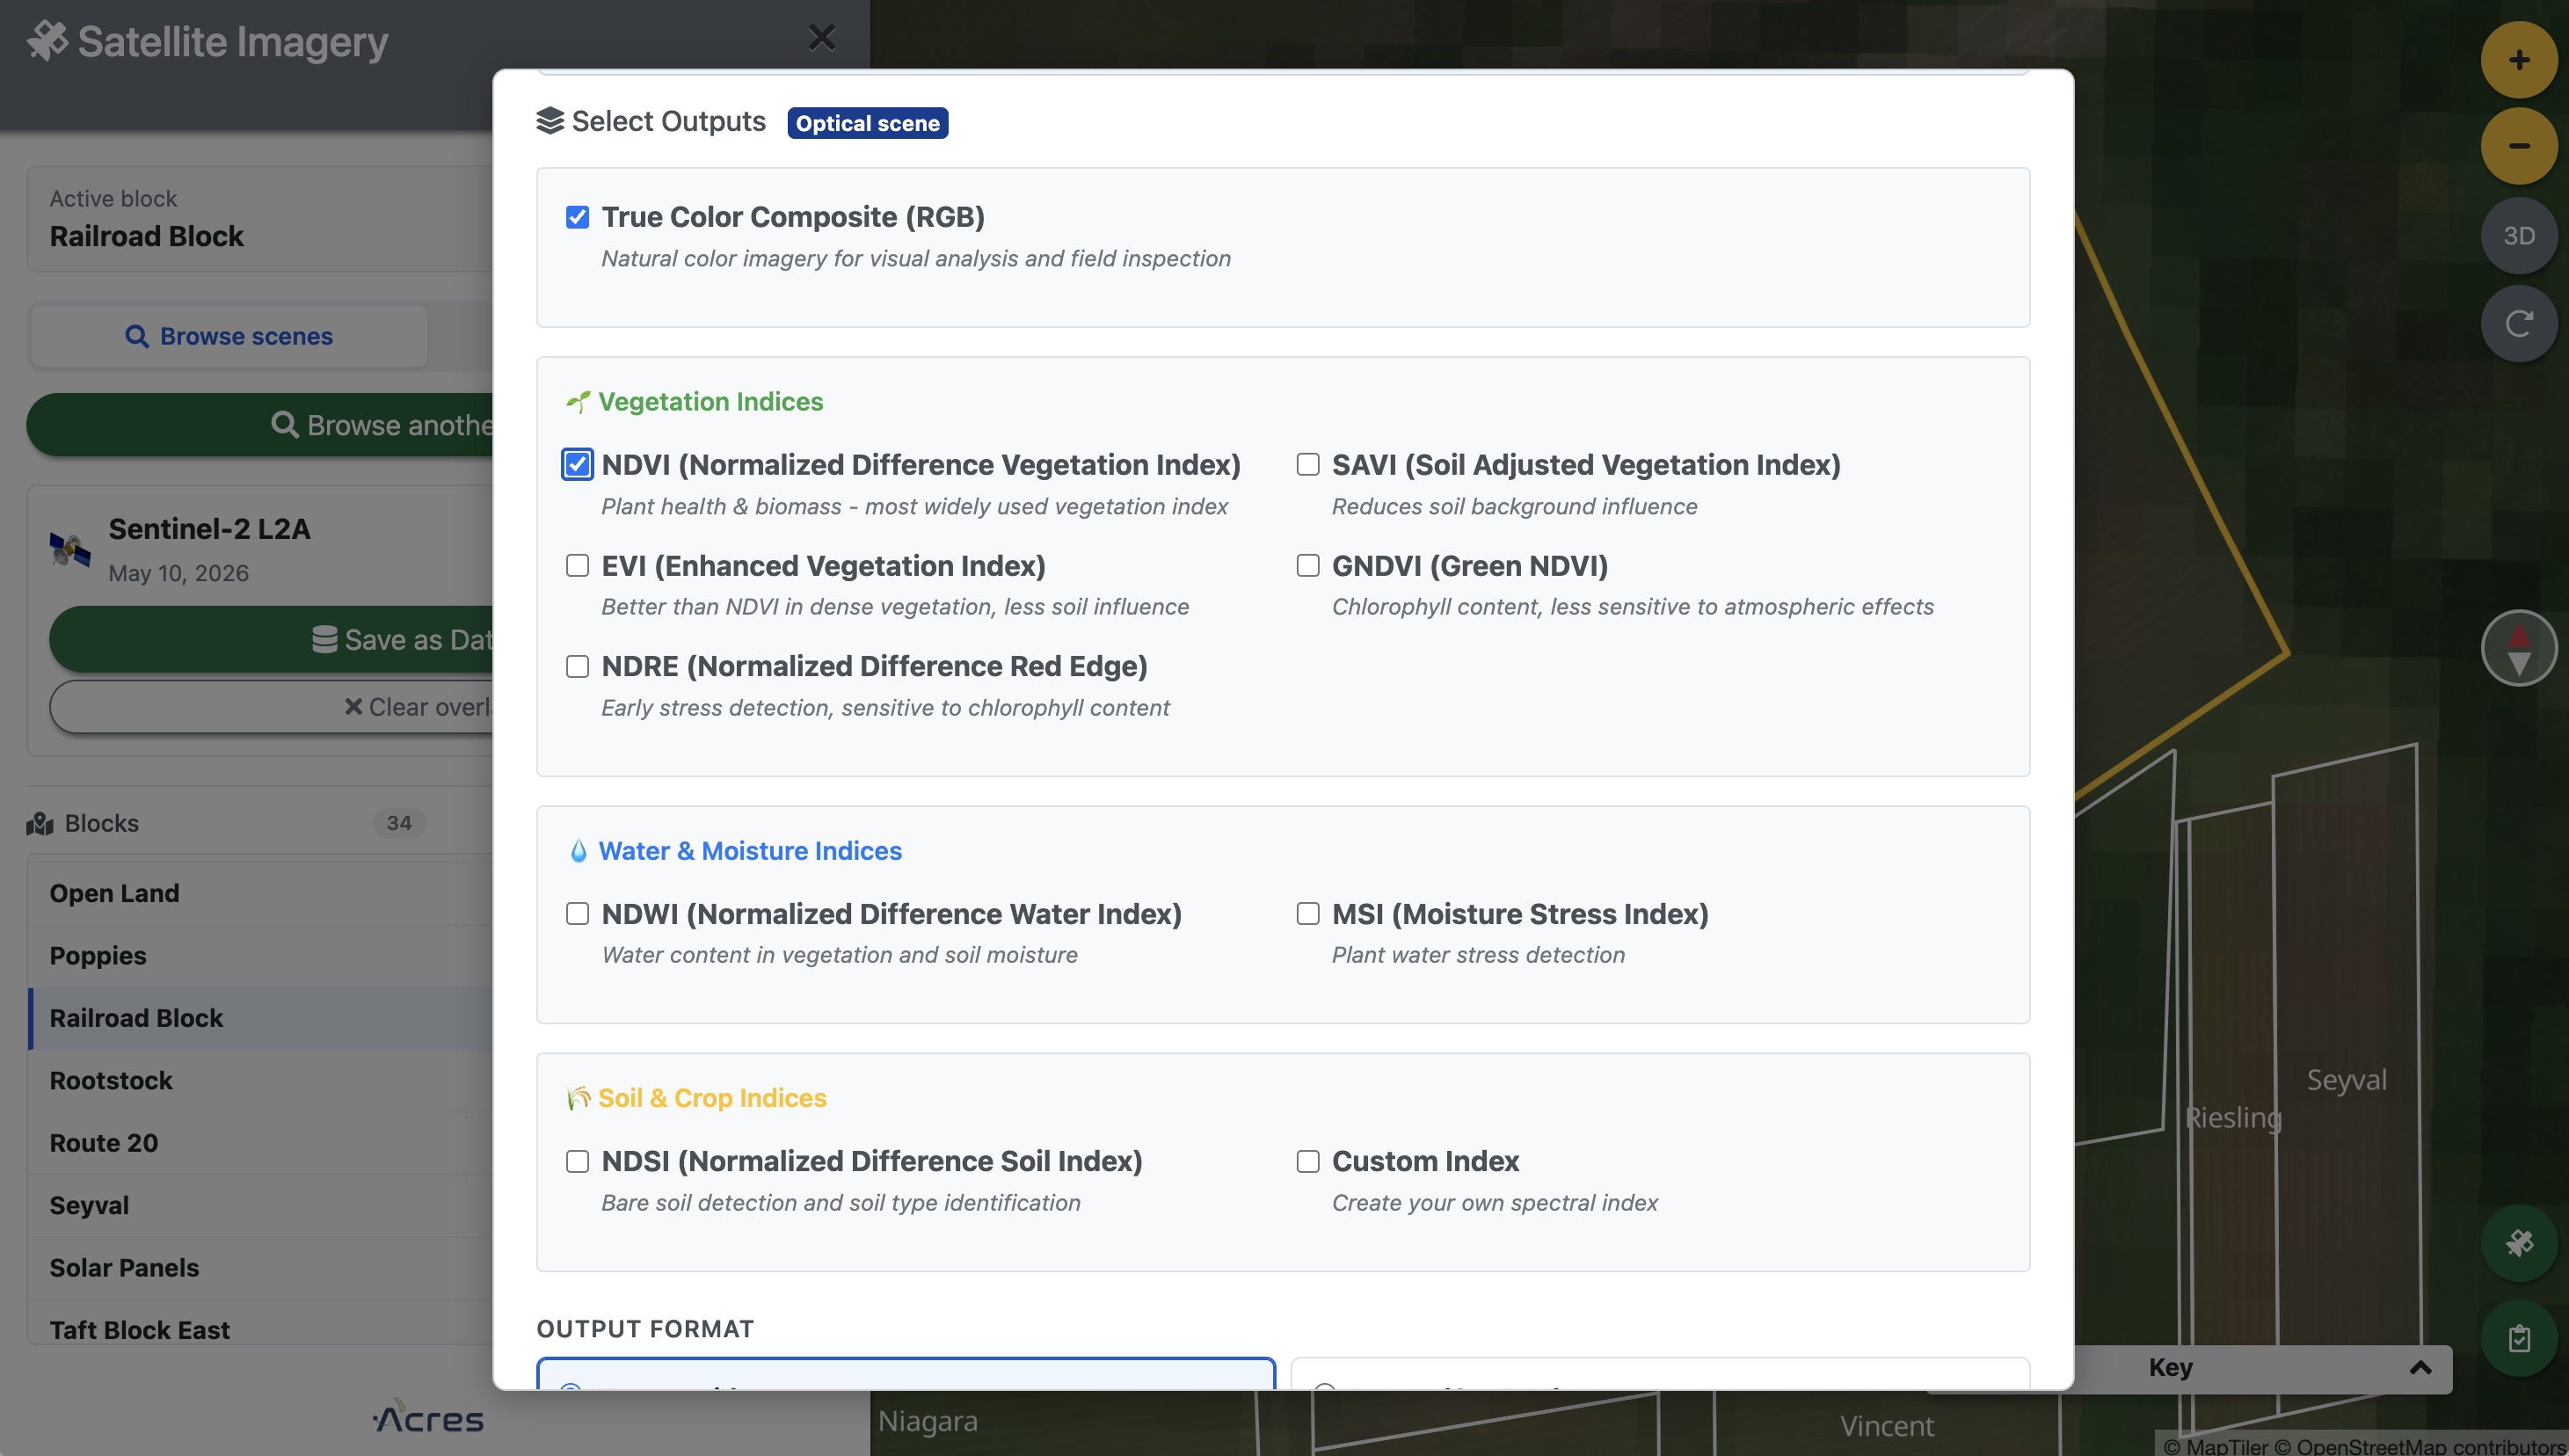
NDVI (Normalized Difference Vegetation Index) is computed from the Near-Infrared and Red bands: (NIR - Red) / (NIR + Red). Healthy green vegetation reflects strongly in NIR and absorbs red light, pushing values toward +1. Bare soil, stressed vines, or missing canopy push values down toward 0 or below. At CLEREL's 10-meter resolution, each pixel represents a 10×10-meter patch of vineyard — roughly one to two vine rows depending on spacing.
Scroll to the bottom and review What will be created: Every.Farm shows a precise list before you commit — in this case, two datasets.
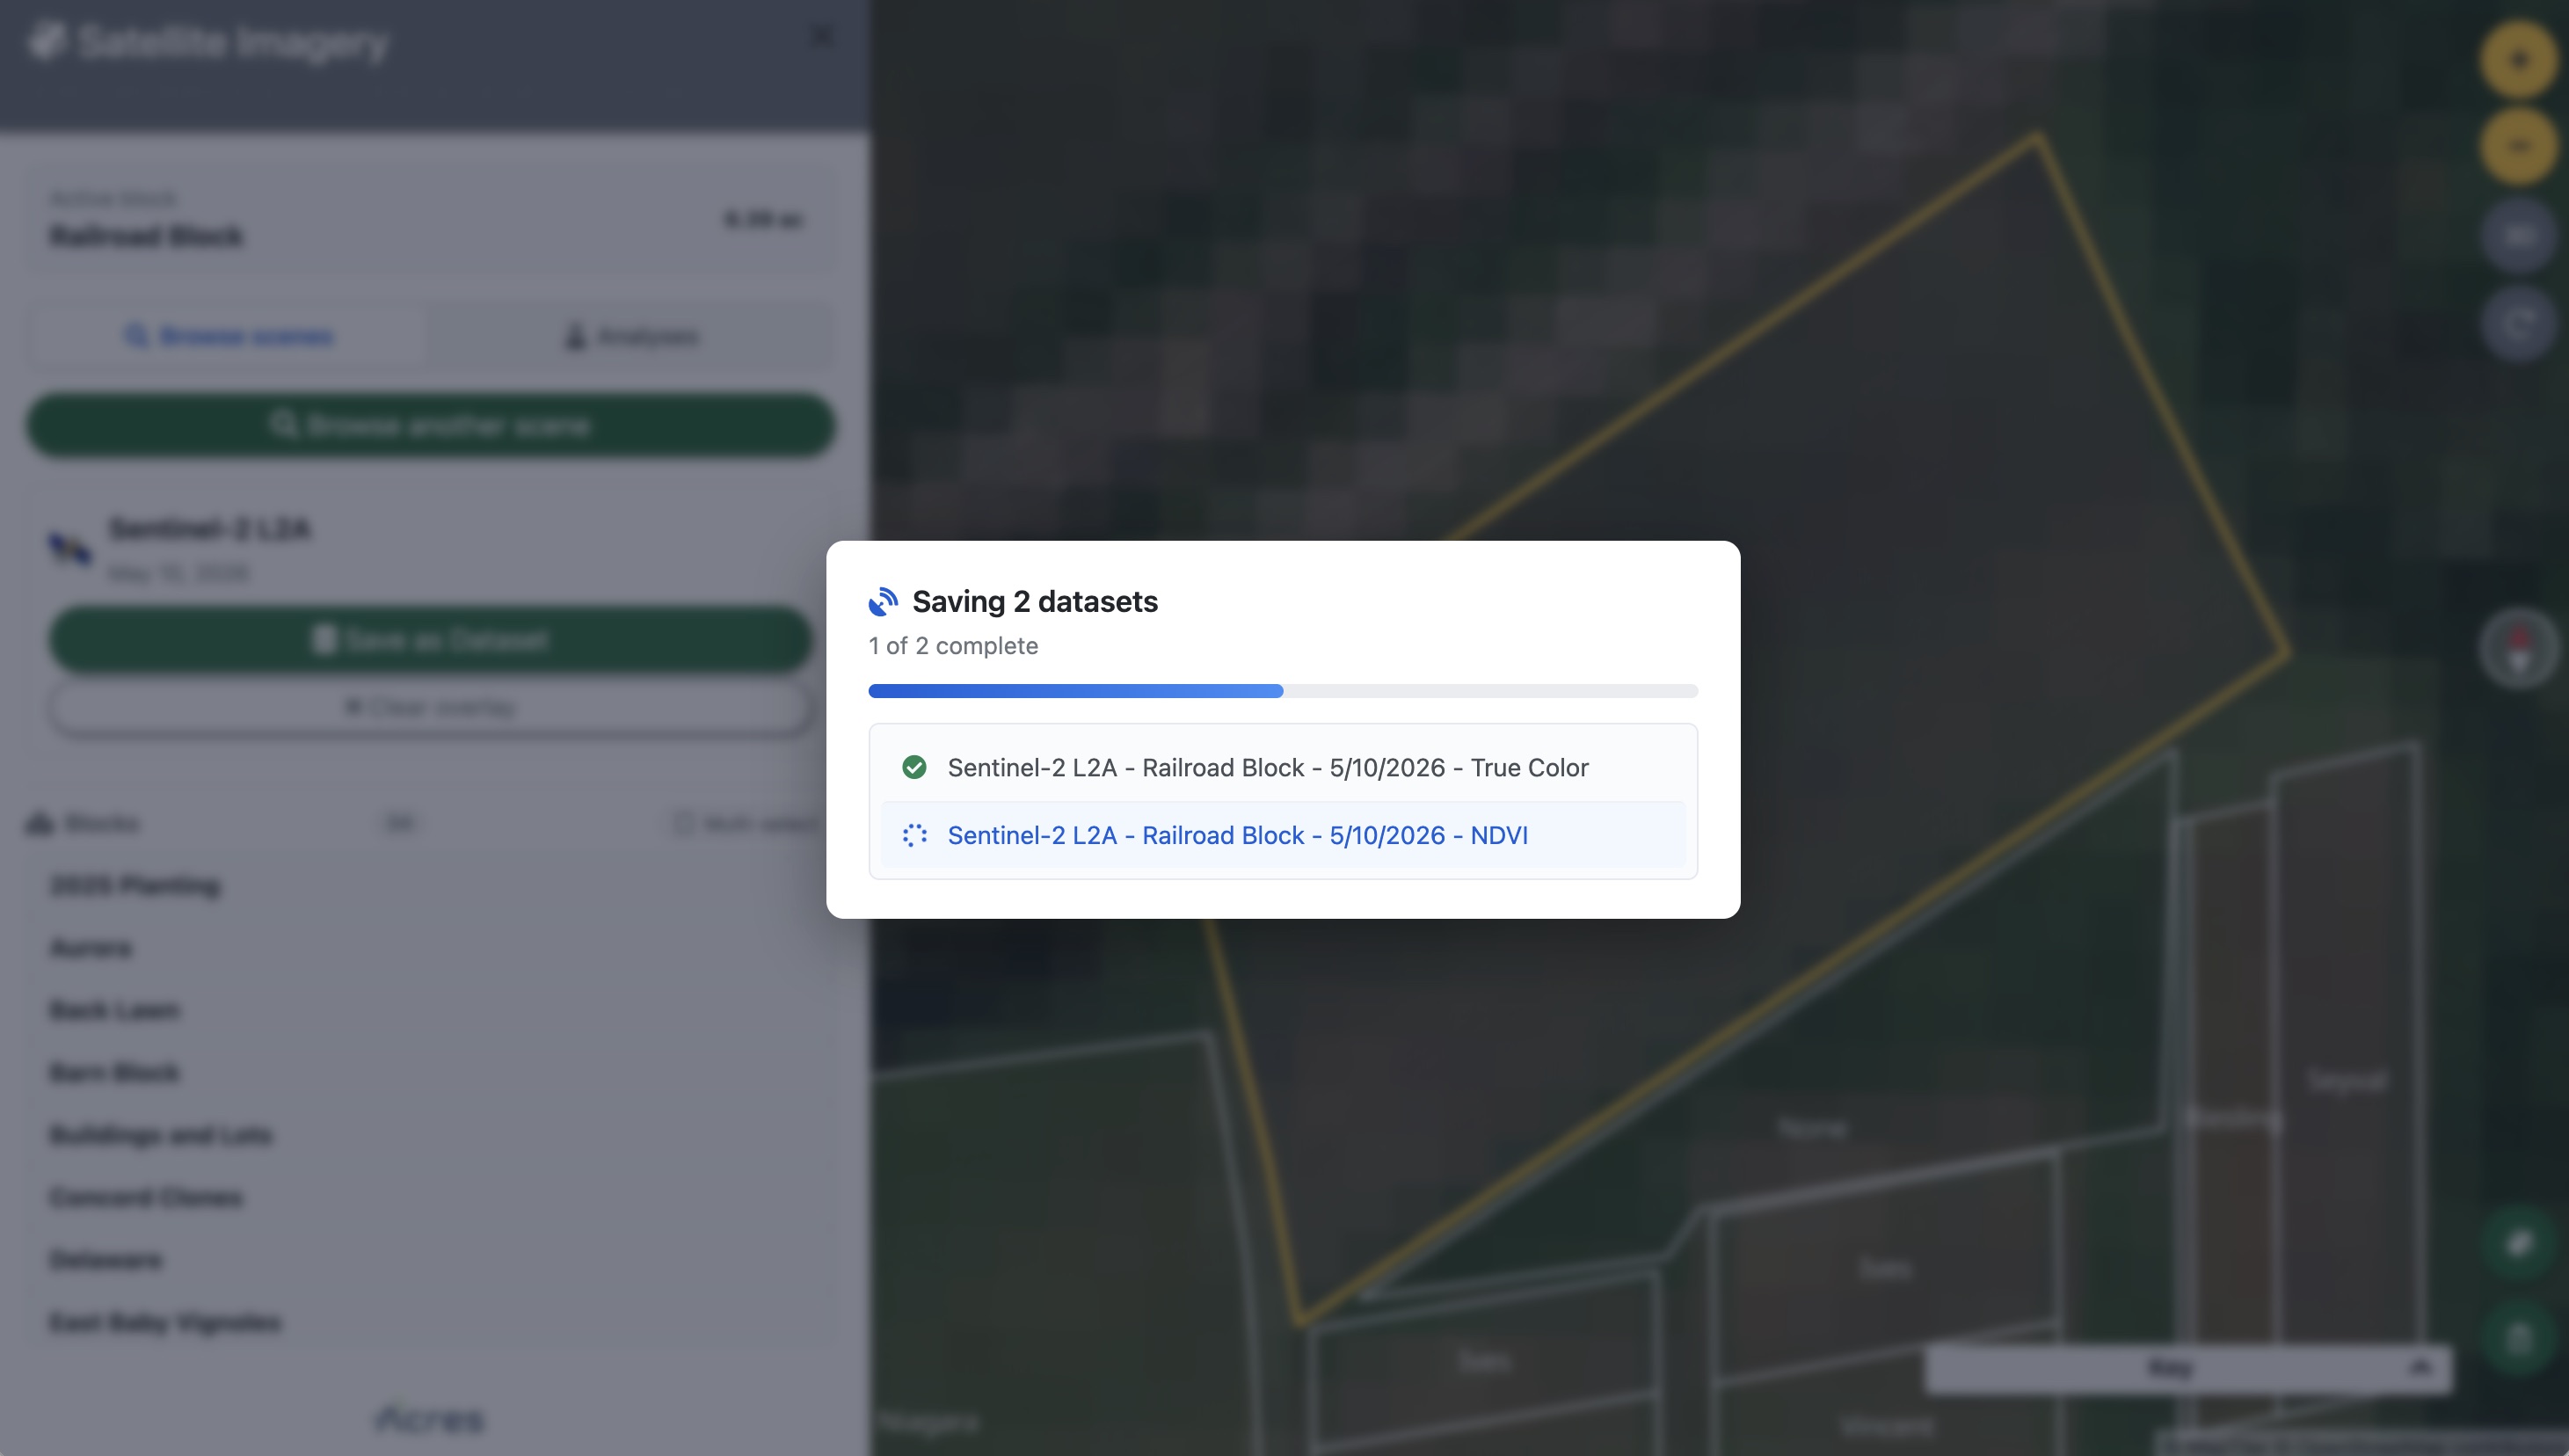
Click Create 2 Dataset(s). Processing runs in the background and typically completes in under two minutes for a single block. You'll see the new datasets appear in the Datasets panel under whichever folder you chose.
Step 6 — Read the NDVI map
Open the Datasets panel (the stacked-layers icon on the left), navigate to your Sentinel-2 folder, and click the NDVI dataset. Every.Farm renders each 10-meter cell as a colored polygon, with the legend anchored to the actual min and max values in this dataset.
What you're looking for at this stage of the season:
- Uniformly high NDVI across a block means the canopy is leafing out evenly — good sign heading into bloom.
- Low-NDVI patches within an otherwise green block can indicate vine-level stress, a drainage issue, winter injury, or simply a gap in the trellis from a missing vine. Worth a walk.
- Differences between blocks of the same variety are often worth investigating. Two Concord blocks with visibly different NDVI in mid-May — same soil type, same management — can reveal microclimate effects, disease pressure, or differences in how winter pruning was executed.
- Very low values at block edges are common and usually a canopy-edge artifact, not a real problem.
One practical note: NDVI is a ratio, not an absolute reading. Compare it to the same block on the same date in a prior year, or to neighboring blocks in the same scene. A value of 0.45 means something different in early May than it does in late July.
What's next
This walkthrough covered a single block and a single scene. The same workflow scales across the entire farm — and because Every.Farm stores each dataset by block and date, you can stack multiple scenes over the growing season and watch canopy development unfold week by week.
A few directions worth exploring from here:
- Multi-block ingestion: select several blocks at once in the satellite plugin before clicking Browse Imagery to process the whole farm in a single pass.
- Analyses tab: the Analyses tab in the satellite plugin lets you build and save index recipes — useful if you want to run the same NDVI + NDWI combination on every scene you ingest going forward.
- Compare years: pull the same date range from 2023 and 2024 and stack the NDVI maps. Blocks that track consistently are behaving predictably; blocks that diverge year-to-year are telling you something.
Satellite data doesn't replace walking the vineyard. But it tells you which rows to walk — and in a research setting like CLEREL, or on a commercial farm where scouting time is finite, that's exactly the leverage you need.
Want to try this on your own farm? Open Every.Farm — it's free while we're in research-platform mode.